

Spotted Wing Drosophila Monitoring Report June 3, 2016
go.ncsu.edu/readext?414353
en Español / em Português
El inglés es el idioma de control de esta página. En la medida en que haya algún conflicto entre la traducción al inglés y la traducción, el inglés prevalece.
Al hacer clic en el enlace de traducción se activa un servicio de traducción gratuito para convertir la página al español. Al igual que con cualquier traducción por Internet, la conversión no es sensible al contexto y puede que no traduzca el texto en su significado original. NC State Extension no garantiza la exactitud del texto traducido. Por favor, tenga en cuenta que algunas aplicaciones y/o servicios pueden no funcionar como se espera cuando se traducen.
Português
Inglês é o idioma de controle desta página. Na medida que haja algum conflito entre o texto original em Inglês e a tradução, o Inglês prevalece.
Ao clicar no link de tradução, um serviço gratuito de tradução será ativado para converter a página para o Português. Como em qualquer tradução pela internet, a conversão não é sensivel ao contexto e pode não ocorrer a tradução para o significado orginal. O serviço de Extensão da Carolina do Norte (NC State Extension) não garante a exatidão do texto traduzido. Por favor, observe que algumas funções ou serviços podem não funcionar como esperado após a tradução.
English
English is the controlling language of this page. To the extent there is any conflict between the English text and the translation, English controls.
Clicking on the translation link activates a free translation service to convert the page to Spanish. As with any Internet translation, the conversion is not context-sensitive and may not translate the text to its original meaning. NC State Extension does not guarantee the accuracy of the translated text. Please note that some applications and/or services may not function as expected when translated.
Collapse ▲In order to help growers and other interested parties track spotted wing drosophila (SWD) activity and aid management decisions, we have established adult trapping sites around North Carolina in blueberry and blackberry fields. At each site, we have placed a total of 8 traps, 4 baited with our standard yeast sugar water bait (YSW, described in detail) and 4 baited with a commercially available lure manufactured by Scentry. We are comparing the efficacy of these two attractants across all our monitoring sites. YSW baits are easily made at home at low cost but must be changed weekly and are difficult to see flies floating in. Alternatively, the Scentry lures last up to a month under North Carolina conditions and employ a clear drowning solution that is easier to see flies in, but they are more expensive than YSW baits.
Each week we visit field sites and collect trap contents. We then bring them back to the lab for processing and count all male and female SWD under a microscope. In this post, we’re sharing data from our first month of trap captures. Our weekly posts to follow will update these data as the season progresses.
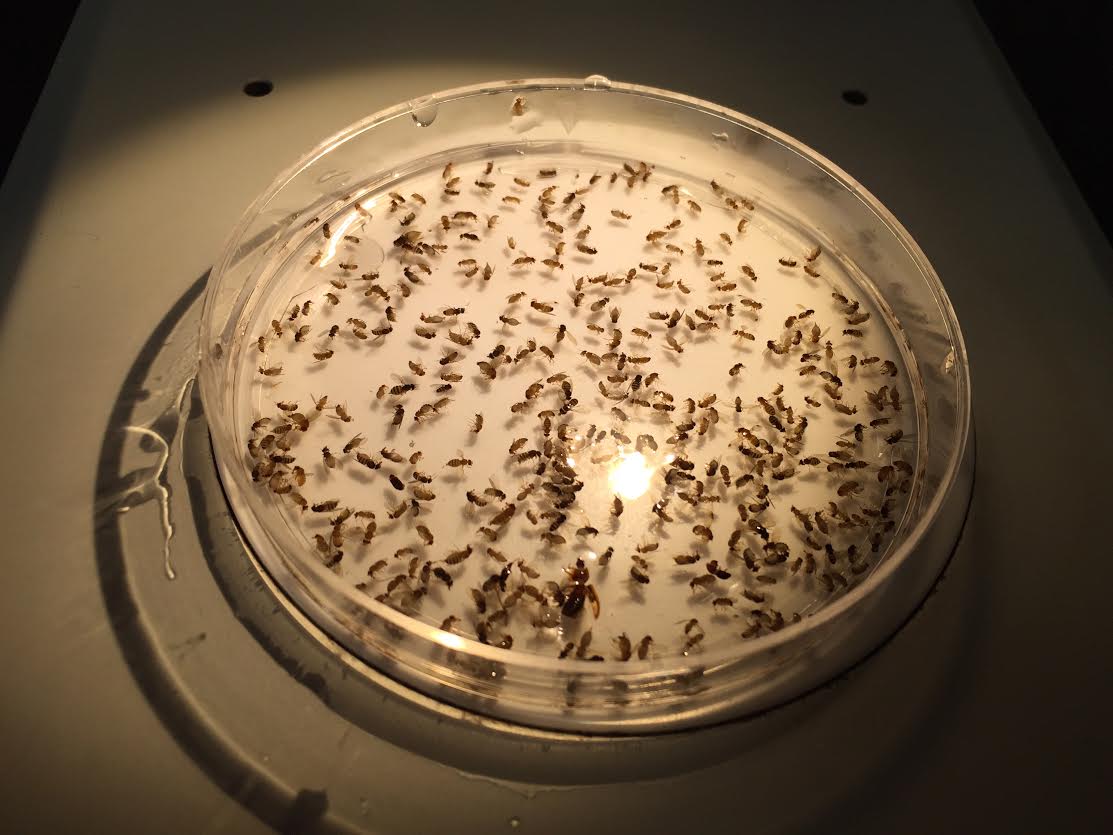
Contents of traps are placed in petri dishes and counted using a microscope. Photo: Grant Palmer
Sites are named by the North Carolina county they are located in followed a number indicating the number of sites within each county. Some counties have only site while others may have up to four.
The average number of total (male and female) SWD captured per site per day are presented in the figures below. Trapping began at six blueberry fields on May 11, 2016. Scentry lures were not available until May 17th, so these were deployed at blueberry locations during the second week of monitoring.
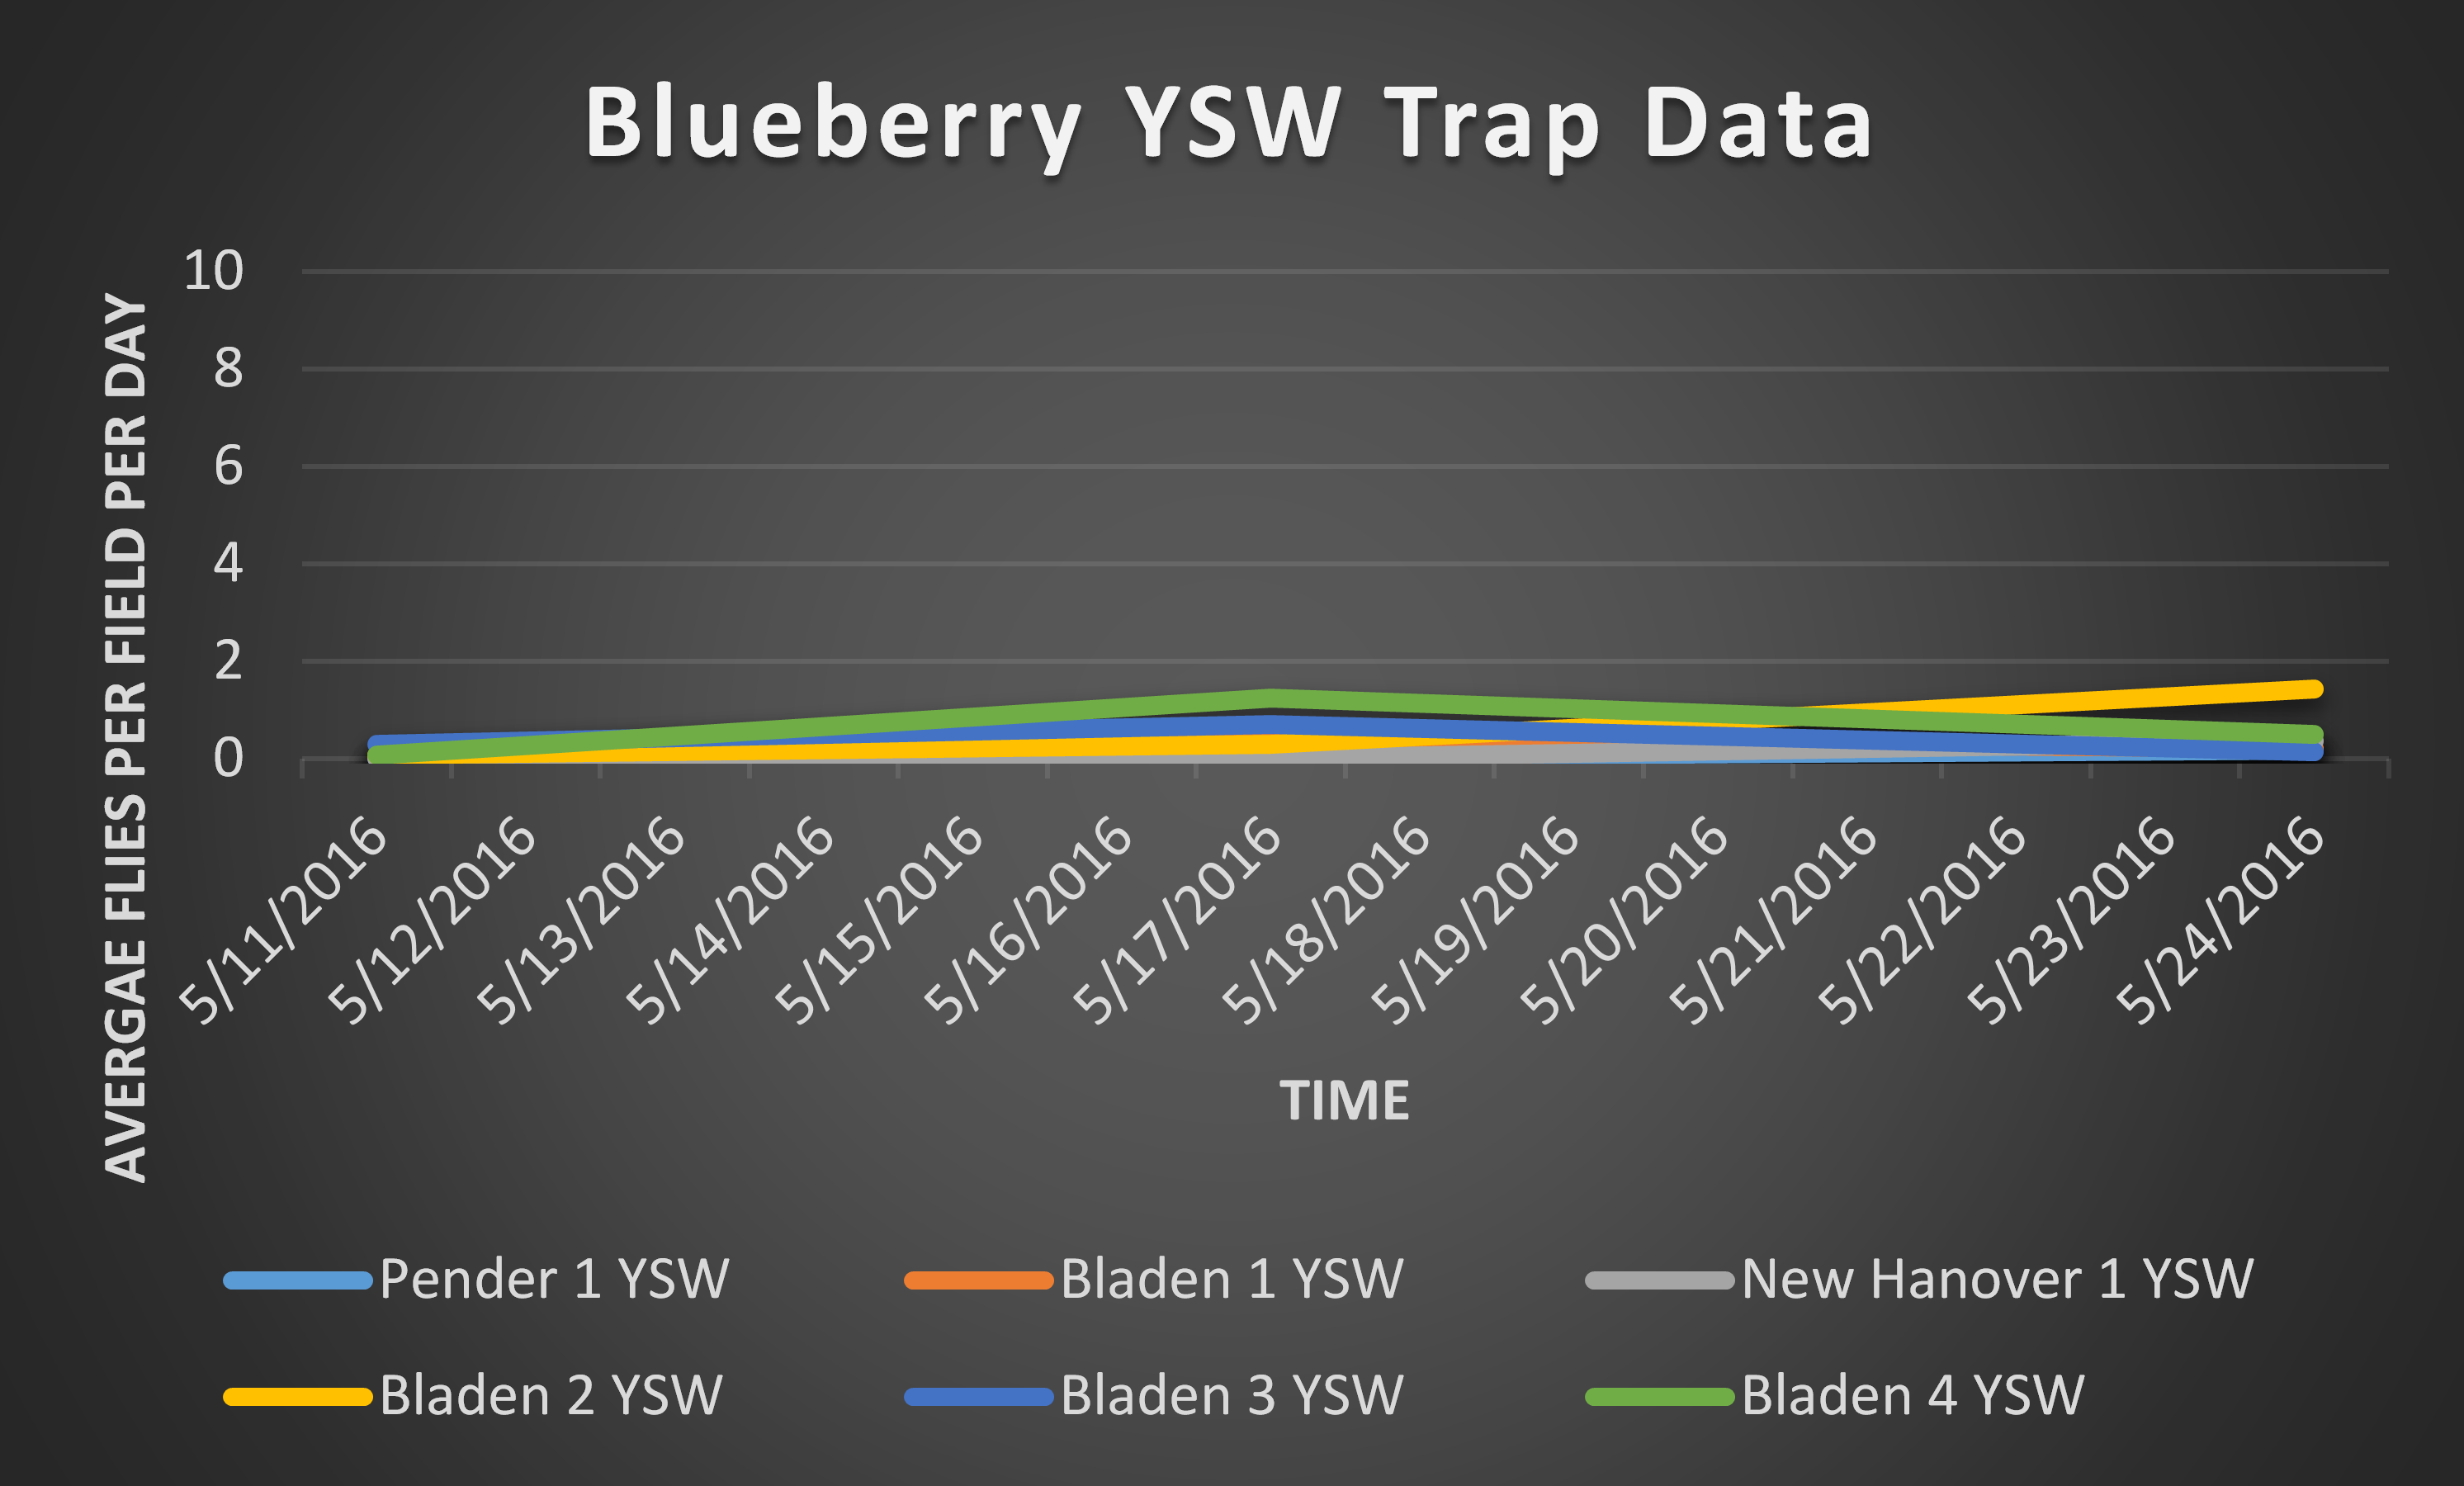
This is a graph depicting number of SWD captured on a total/SWD per day basis
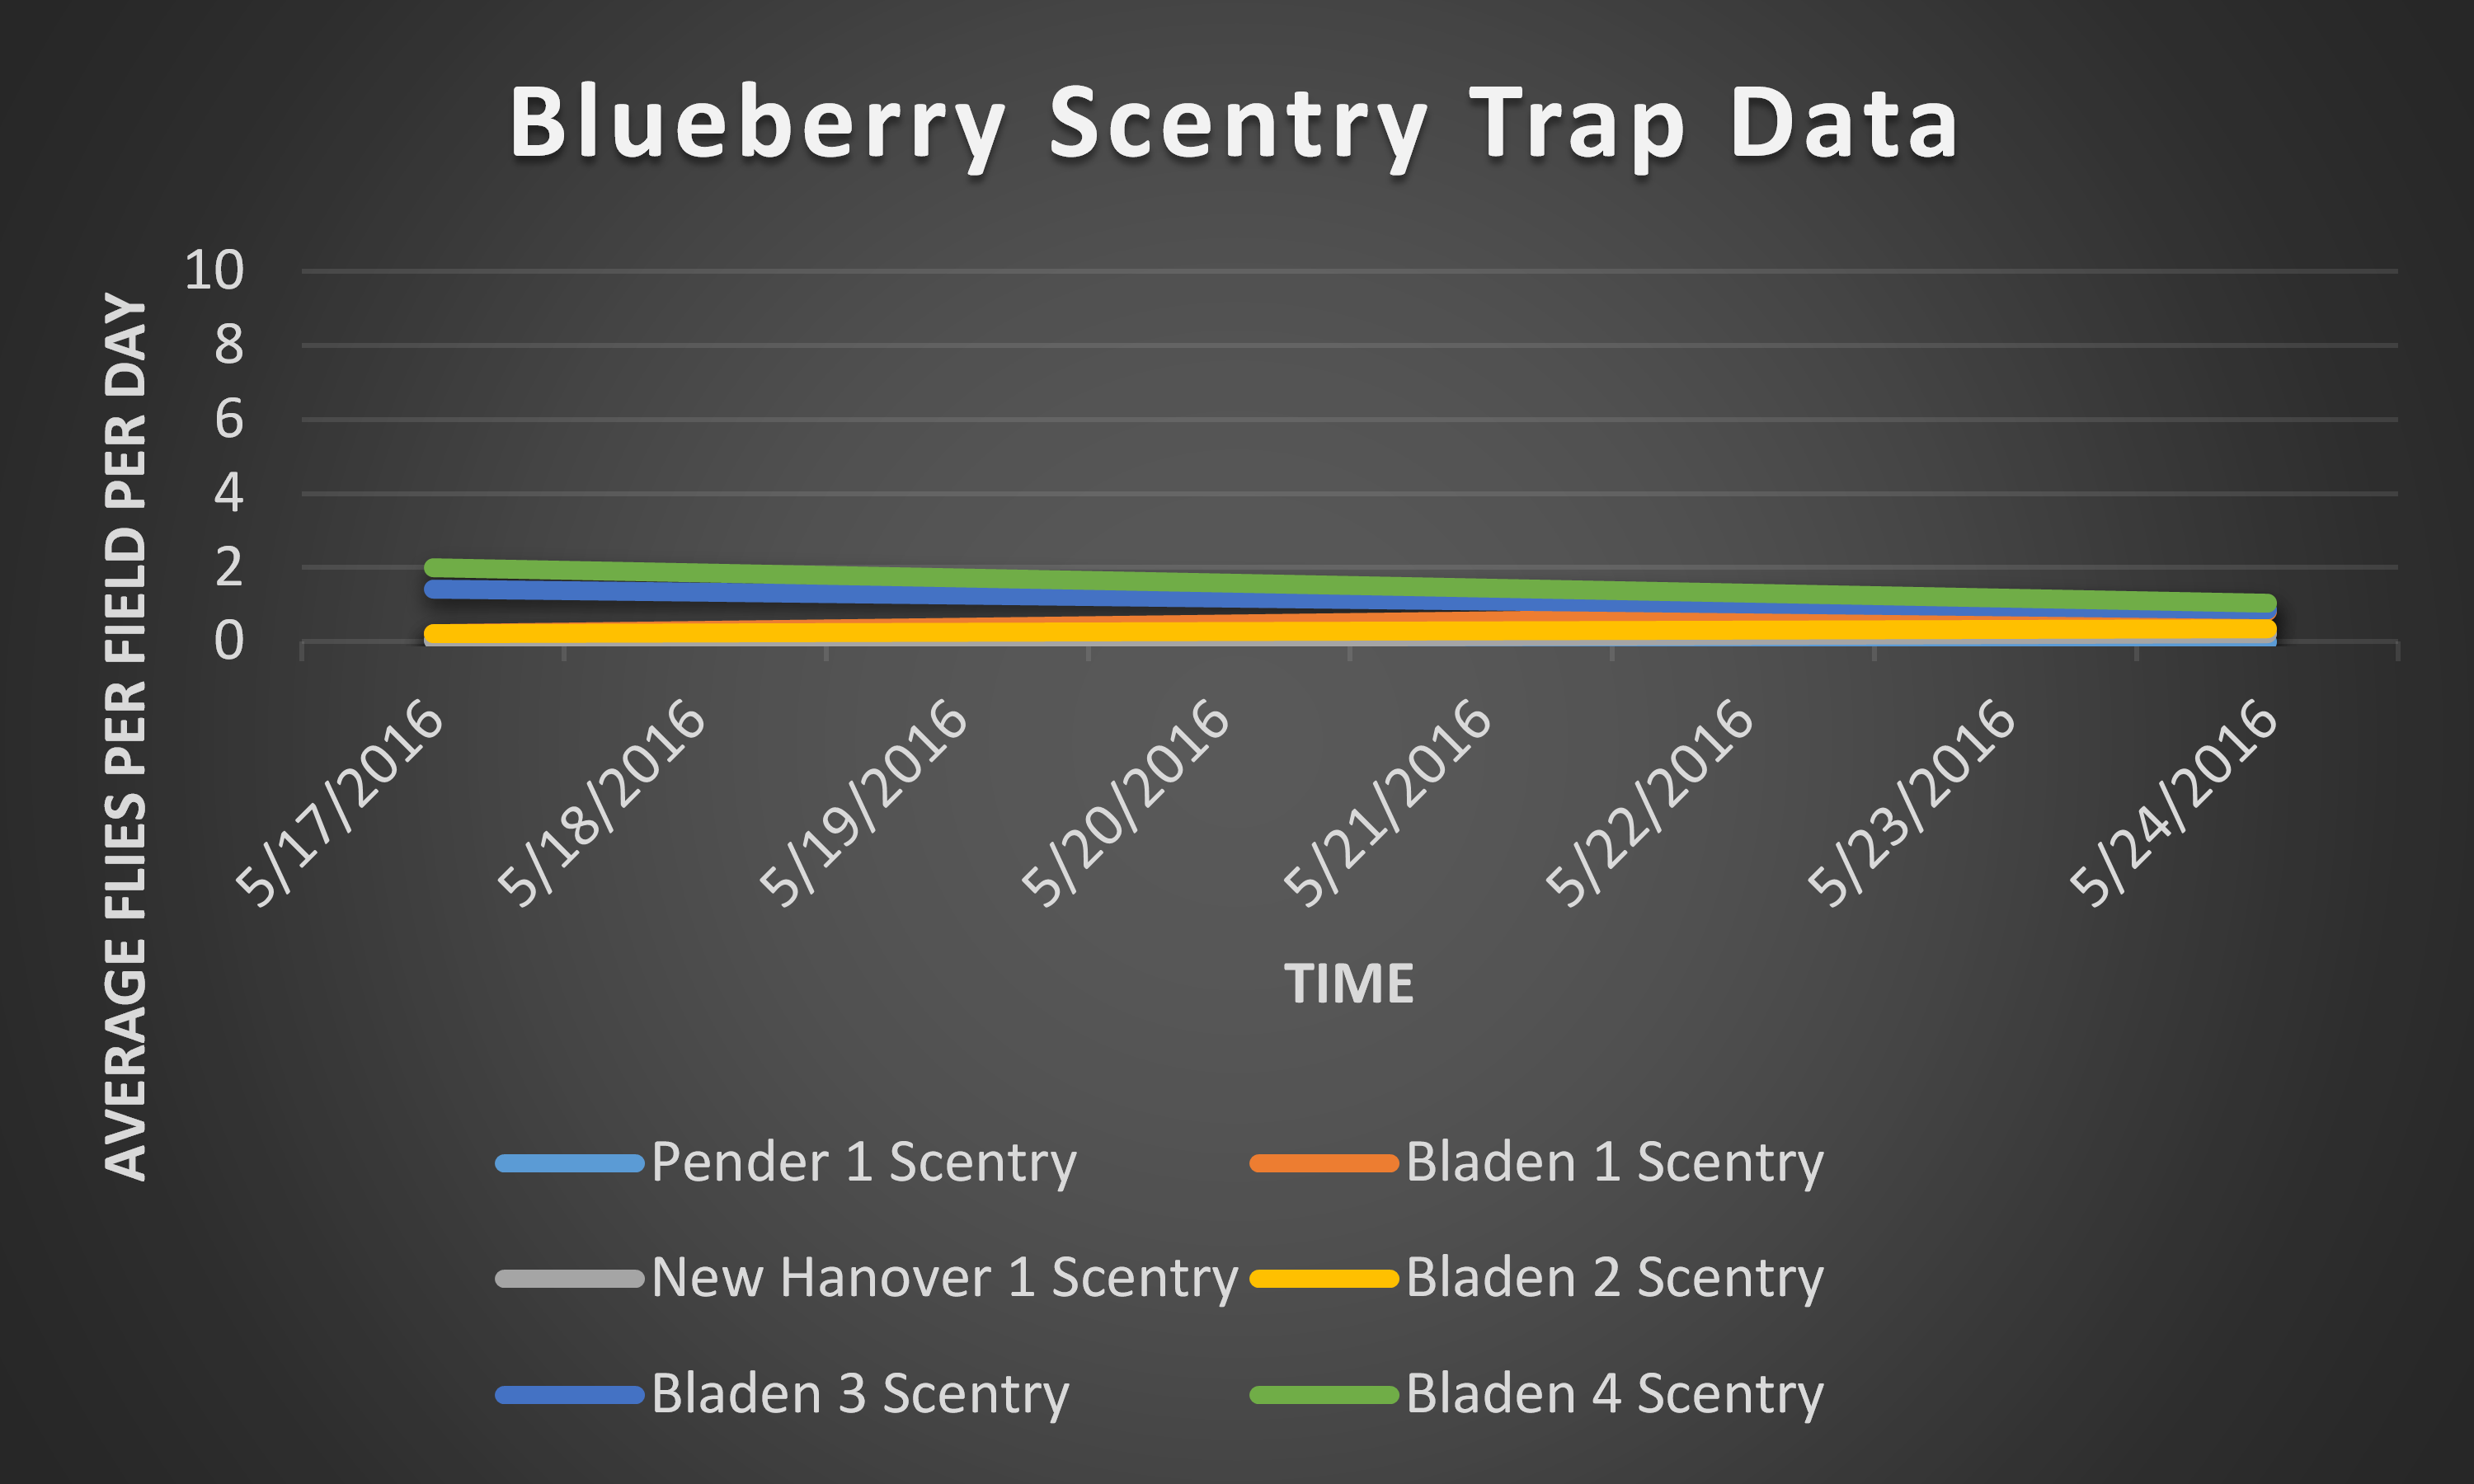
This graph shows the number of SWD caught in the Scentry bait traps from 5/17/2016 through 5/24/2016
We are monitoring a total of five blackberry fields, and first checked traps on May 17, 2016.
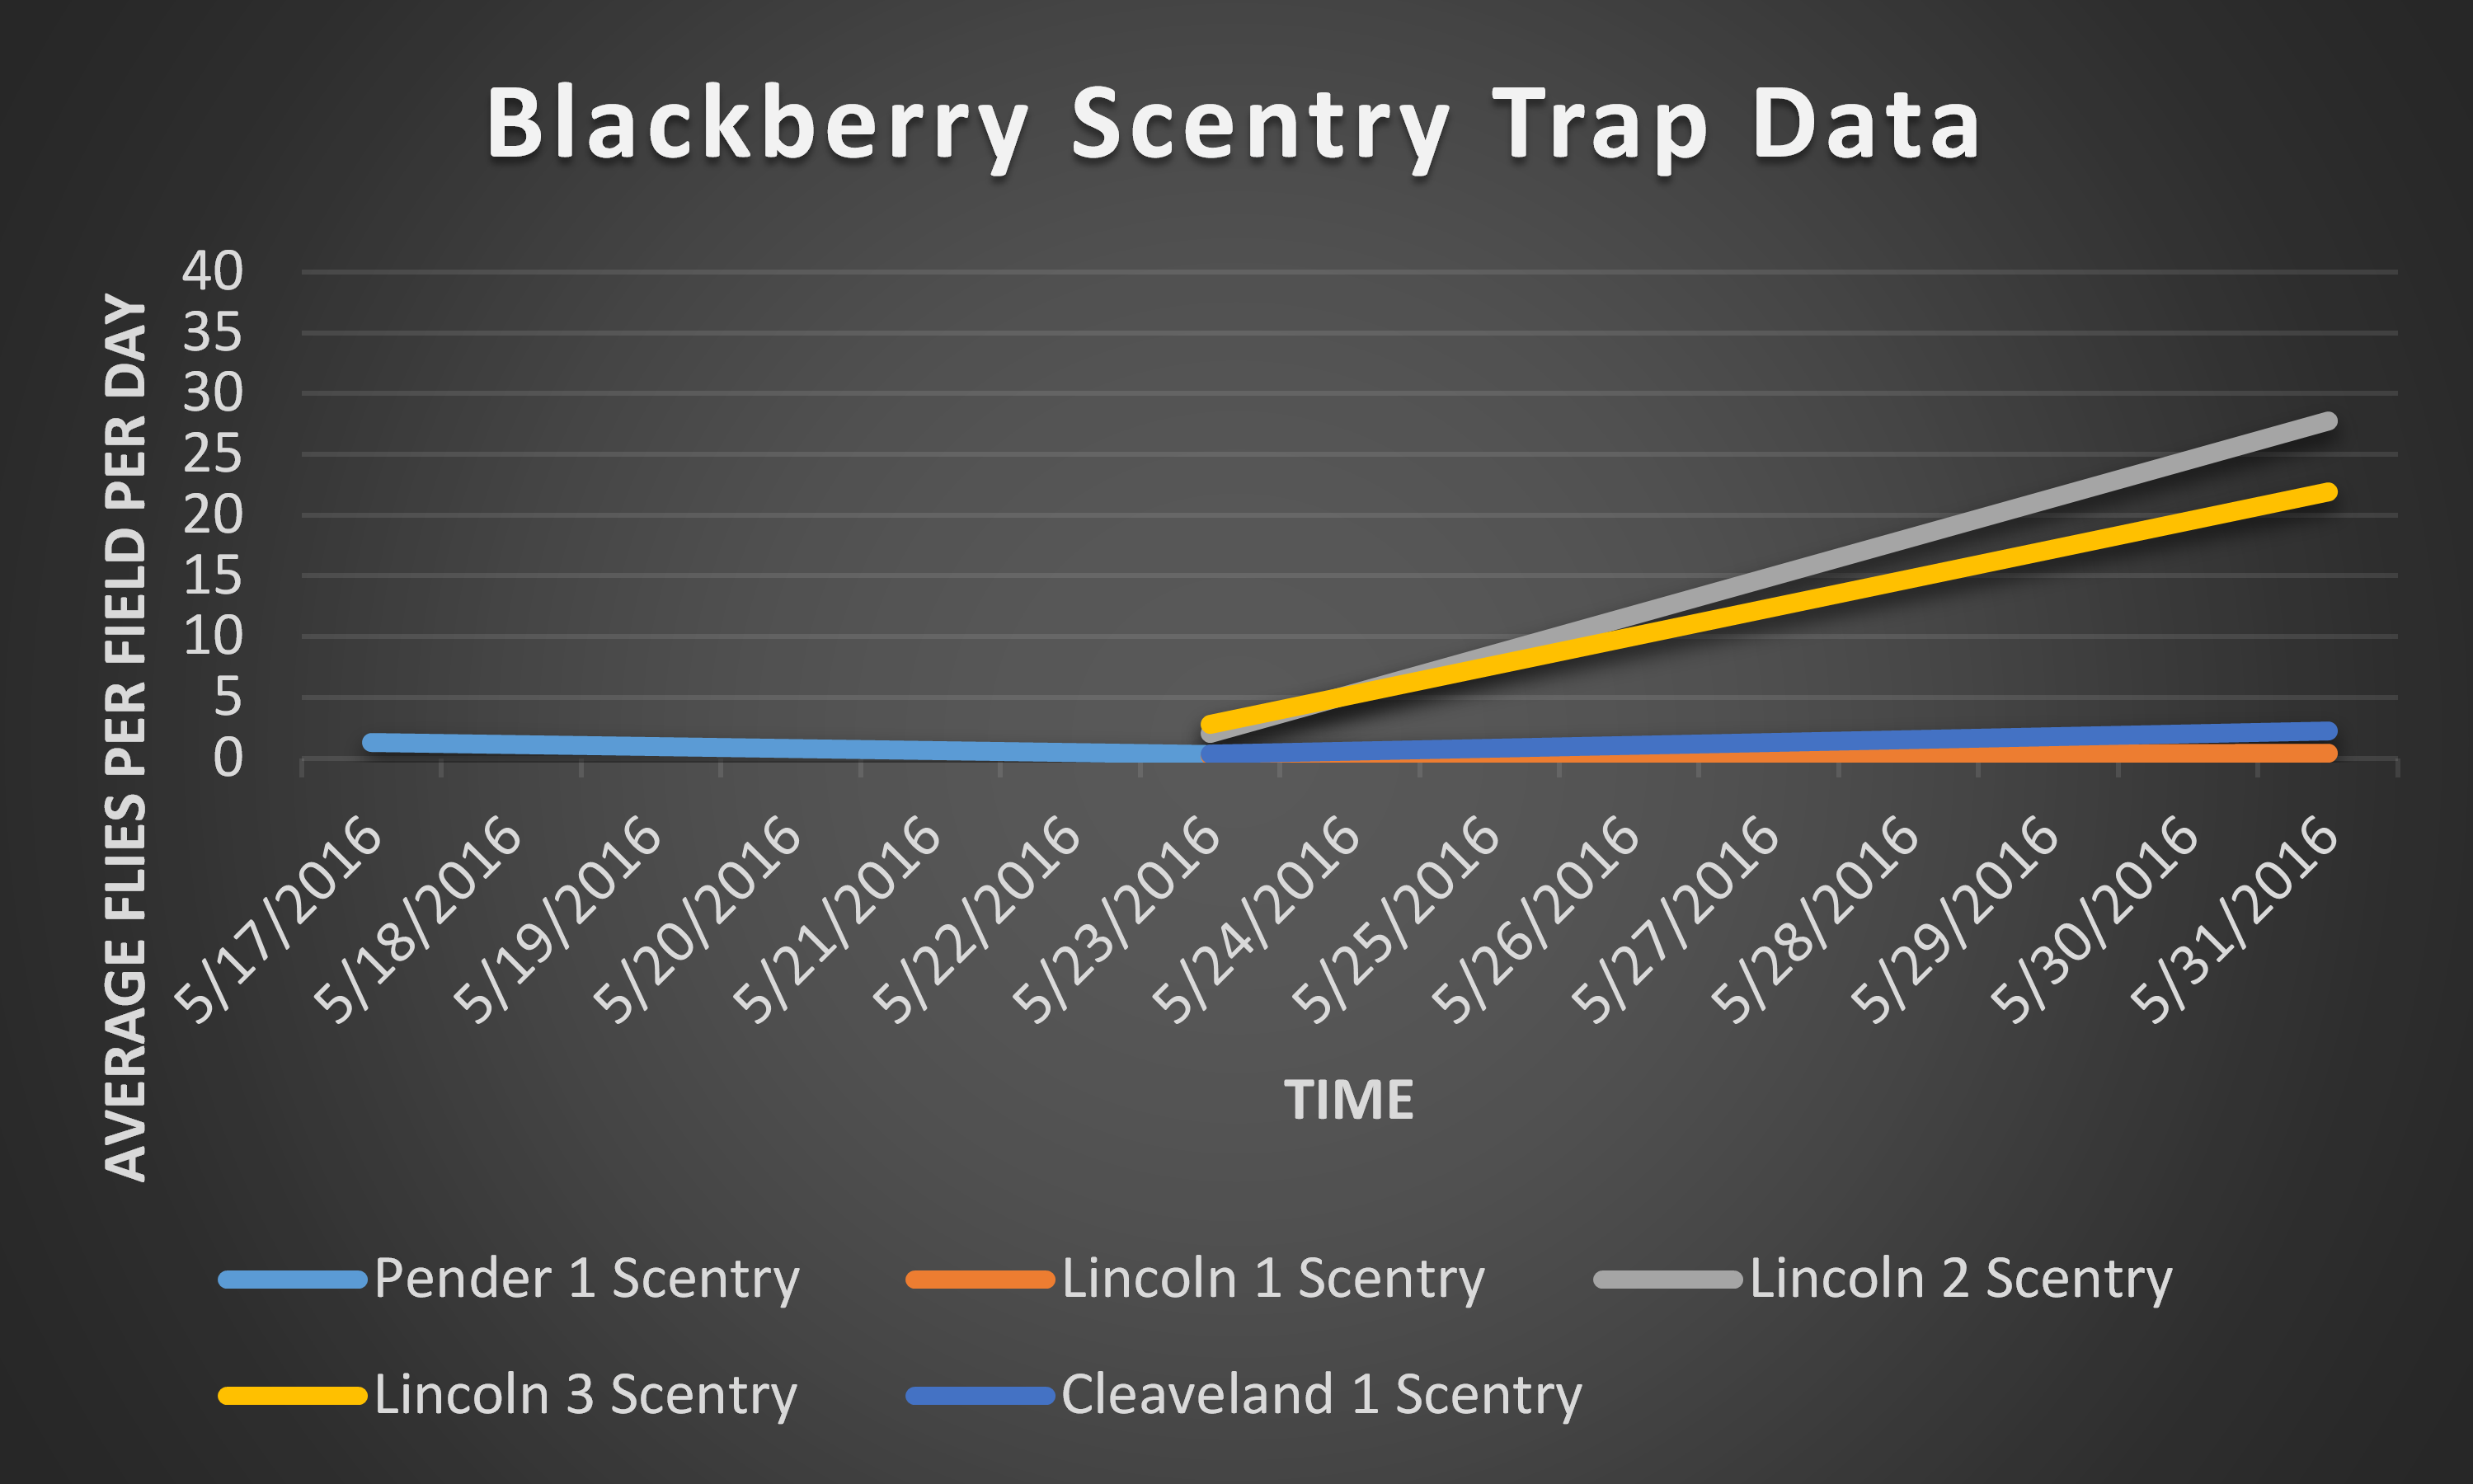
This graph shows the number of SWD caught in the Scentry bait traps from 5/17/2016 through 5/31/2016 in close proximity to blackberry crops
YSW traps from blackberries are still being counted, and data will be posted as they become available.
SWD trap captures are generally lower in blueberry fields than in blackberry fields. Increases in recent trap collections coincide with blackberry ripening.